

Land trusts use various approaches when deciding if a particular piece of property is suitable for acquisition. National Accreditation has driven a formalization of the selection process with many trusts developing or boilerplating quantitative scoring systems. The idea was to both remove the guesswork and remove any biases from the acquisition process.
The selection process is designed to provide information that helps a land trust make decisions. It focuses the board’s deliberations on the important issues. One outcome of the intensive reviews of policy and procedure conducted by many trusts during Accreditation is the realization that while quantitative project selection and evaluation scoring guides land trust’s decisions, it does not give definitive answers. In many cases, it gives useless or bad answers. Nonetheless, the perceived need for a quantitative system has led to the widespread use of scoring systems in acquisitions. Rampant boilerplating and copying what the early accredited trusts used has perpetuated the problem.
The reality is that S&P (Accreditation Standards and Practices) does not specify the use of a quantitative assessment system. Land trusts can use different approaches to create selection processes, including narratives, checklists, and/or cartography. Some land trusts use a combination of these approaches – there is no one “right” way. A land trust simply needs to make sure it has documented its approach and that a copy of this documentation is kept in each project file.
Here are the broad areas of consideration in project selection:
- Consistency with mission and goals,
- Resource and public benefit values (factors weighing in favor of a project),
- Feasibility (factors weighing against a project), and
- Significance or priority of a project.
Problems with numerical ranking:
Creating and applying a scoring system can be daunting because it requires time to identify what constitutes a meaningful score. System design requires rigorous testing and modification, and since time is not a luxury in the land trust world, we rarely commit to what it would take to develop an accurate and precise system.
My experience across two decades in land conservation is that quantitative systems – as they exist today – don’t work. As a matter of fact, the greatest embrace of scoring that I’ve ever seen was when it knocked down a project that the board just didn’t feel like doing, even though it was a worthy project. And now you see why I am obsessed with scoring systems.
Decisionmakers must maintain the perspective of the trust, its donors, and its community and not blindly accept quantitative scoring as the arbiter of whether or not to move forward with a project. They must keep in mind that a scoring system is only one tool and it requires informed use. The score only summarizes the benefits of a project within the design parameters and biases of scoring system design. Scores cannot be (shouldn’t be) used to absolve the board from its responsibility to choose projects that fulfill the organization’s mission, are feasible, and serve a public benefit. A project could easily score low in a quantitative assessment and be an important acquisition, and a high-scoring rating could be generated for an acquisition not worth the trust’s expenditure of resources. More commonly, most acquisition opportunities rank quite highly and the quantitative approach fails to discriminate in any meaningful way.
One approach to decision-making includes assessing ecological significance, ecological risk, listed species, scenic value, farming, development risk, and proximity to current land trust holdings. Are these seven factors all equally significant or are some more important than others? For instance, how do you compare habitat significance and farming value?
And more importantly, how do you compare rarity? Many projects are driven by rarity. Here is the matrix from the landmark paper, The Seven Forms of Rarity by Deborah Rabinowitz (Rabinowitz, D. 1981. Seven forms of rarity. The biological aspects of rare plant conservation (ed. by H. Synge), pp. 205–217. John Wiley & Sons, Chichester):
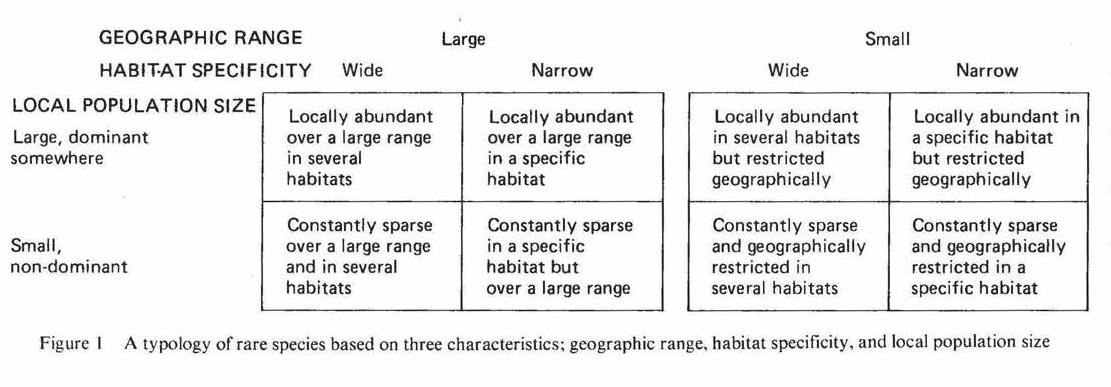
How do you apply meaningful quantitative values to grid elements? Clearly, something that has a small geographic range with a restricted habitat requirement and a tiny population ranks high. But how high compared to something with that is geographically restricted but locally abundant? And because something regionally common is present on a property, does that mean that it gets a low ranking? Are we all about protecting representative habitats or functioning landscapes? How does this factor into quantitative measures?
Espeland et al. (Espeland, E.K. & Emam, T.M. 2011. The value of structuring rarity: the seven types and links to reproductive ecology. Biodivers Conserv 20: 963. https://doi.org/10.1007/s10531-011-0007-2) looked at other factors driving rarity including mating systems and dispersal mechanisms, which for those of us seeking a realistic model further complicates the development of a meaningful quantitative measurement system for ranking acquisitions. Readers thinking about rarity or conservation ranking are encouraged to read Rabinowitz and Espeland et al.
Continuing the discussion, how do you compare legally listed species in an acquisitions scoring system? Are all listed species, be they of special concern, threatened, or rare, equal? How do you assign a logical numerical value to these categories and the various beings within the categories? Is an endangered horsefly as valuable as a threatened bird?
Let’s look at a simpler metric. How do you compare threat from development? Thinking this through, there are many factors that describe such threat. Let’s look at the level of detail that would be required in a simple, 2-element development-threat ranking system:
Threat from Development (maximum of 20 points):
A. Proximity to public sewer and water service
Adjacent to existing service area = 10
Within ¼ mile of existing service area = 8
Within ½ mile of existing service area = 6
Within 1 mile of existing service area = 4
Within 2 miles of existing service area = 2
B. Number of feet of road frontage
Extensive, developable road frontage (2,000+ feet) = 10
Strongly developable road frontage (1000+ feet) = 8
Moderate road frontage (500–1,000 feet) = 6
Limited frontage (50–500 feet) = 4
Interior lot with no frontage = 2
Landlocked with no access = 0
This is the most simple example, and most of the metrics in a functional quantitative system would require a much greater level of detail, a level that is not common in the current acquisition scoring methods or staff talent of most trusts. In Northwestern Connecticut, the Greenprint model (http://litchfieldgreenprint.org) is an example of a functional quantitative system and it took years of work to create, test, and refine it. Even then, Greenprint cannot be relied upon to drive a final decision because the qualitative attributes of any particular parcel are critical to decision-making and are not adequately measured with quantitative techniques.
Ultimately, what I am saying here is that the quantitative approach is not suitable for most trusts. You’re probably better off with a qualitative list of a parcel’s attributes, or better, a rapid ecological assessment (REA) prepared by a qualified ecologist. REAs are focused studies that characterize a property at a level of detail that provides the board with a good coarse-grained understanding of a property’s habitats. This contrasts with other reports such as the baseline documentation report (BDR) that must provide sufficient depth and analysis to withstand legal and IRS challenges. REAs inform the board whilst BDRs are the very armor of the trust.
The quantitative approach is perhaps most useful in dealing with multiple potential projects while operating under tight financial and staff limitations. It provides richly layered information for GIS-based modeling, such as is the case in the Greenprint model. However, and this is one reason why it is not recommended for general use, it is an advanced application, requiring time and technical expertise and extensive testing.
One way that the trust could use quantitative methodologies is in Strategic Conservation Planning. In this approach, one could execute a town-wide GIS study using something like the landscape-scale Greenprint model to rank future acquisition targets. Once completed, we then rank properties by opportunity, add the qualitative values, refine, and proceed with acquisitions.
Finally, understand that trusts are not permanently locked into the project selection methodology that they submit to the Accreditation Commission. The approach can change as new ideas and models are discovered. We’re all looking for that magical ranking system but until it arrives, qualitative systems are probably the most effective.
-May 15, 2018


